BCC Dashboard

Four pie charts are visible on this screen. The first shows the states of all robots available in BCC. On the second, the status of tasks for today. On the next one you can see how many scenarios are valid and how many will soon expire (4 days until the end of validity). The last graph shows the levels of robot utilization (percentage of robots occupied, free and offline).
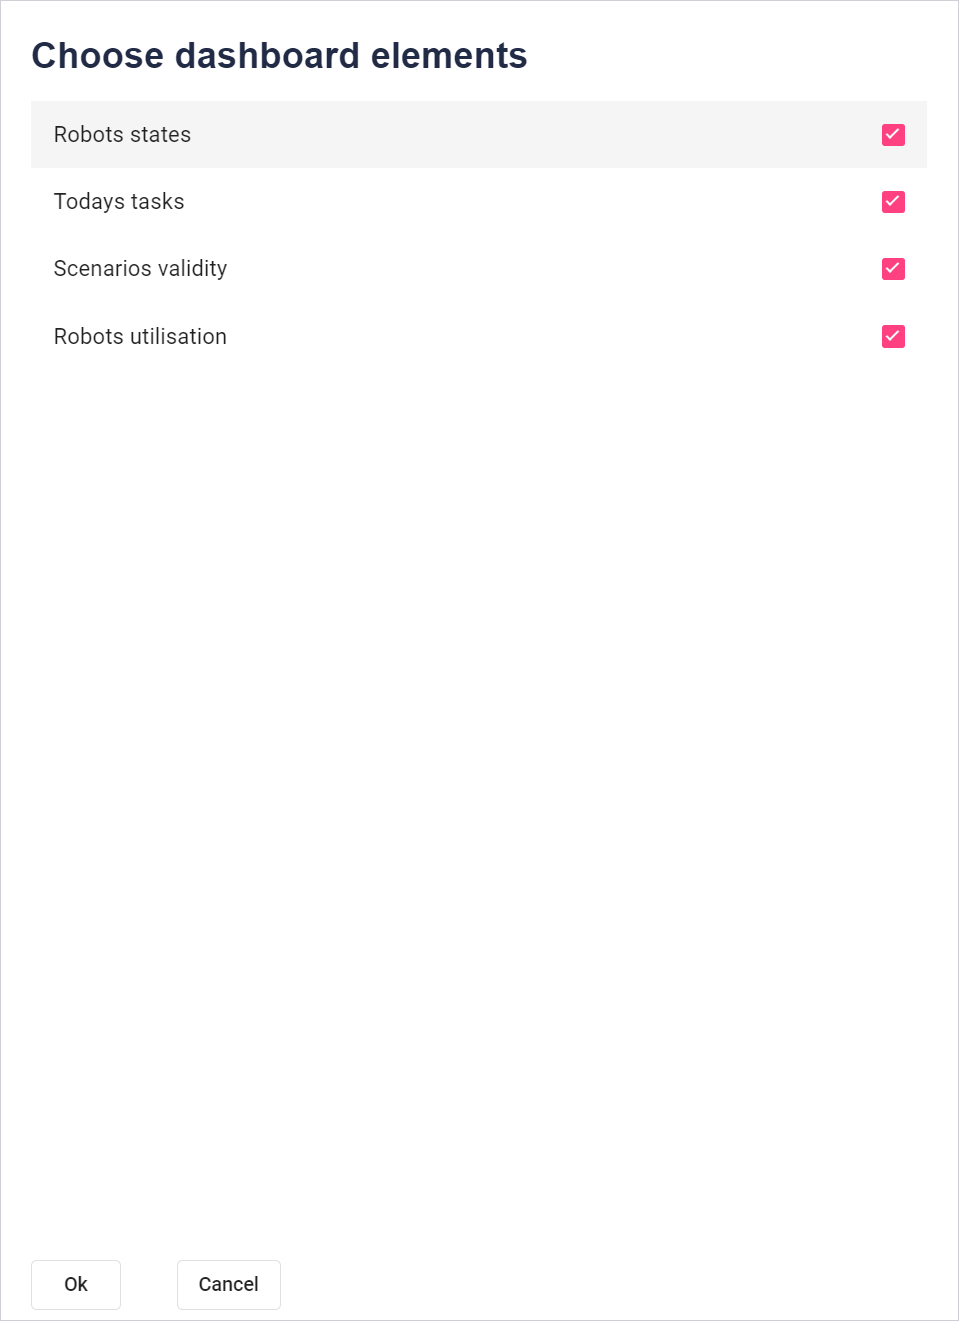
In the upper right corner of the page there is a Configure button, after pressing which a window will open in which you can set which of the charts should be visible. Accept the selection by pressing the Ok button. After clicking Cansel the changes will not be saved.

The Todays tasks, Scenarios validity and Robots utilization charts have a button in the upper right corner that opens a page with the statistics of a specific chart.
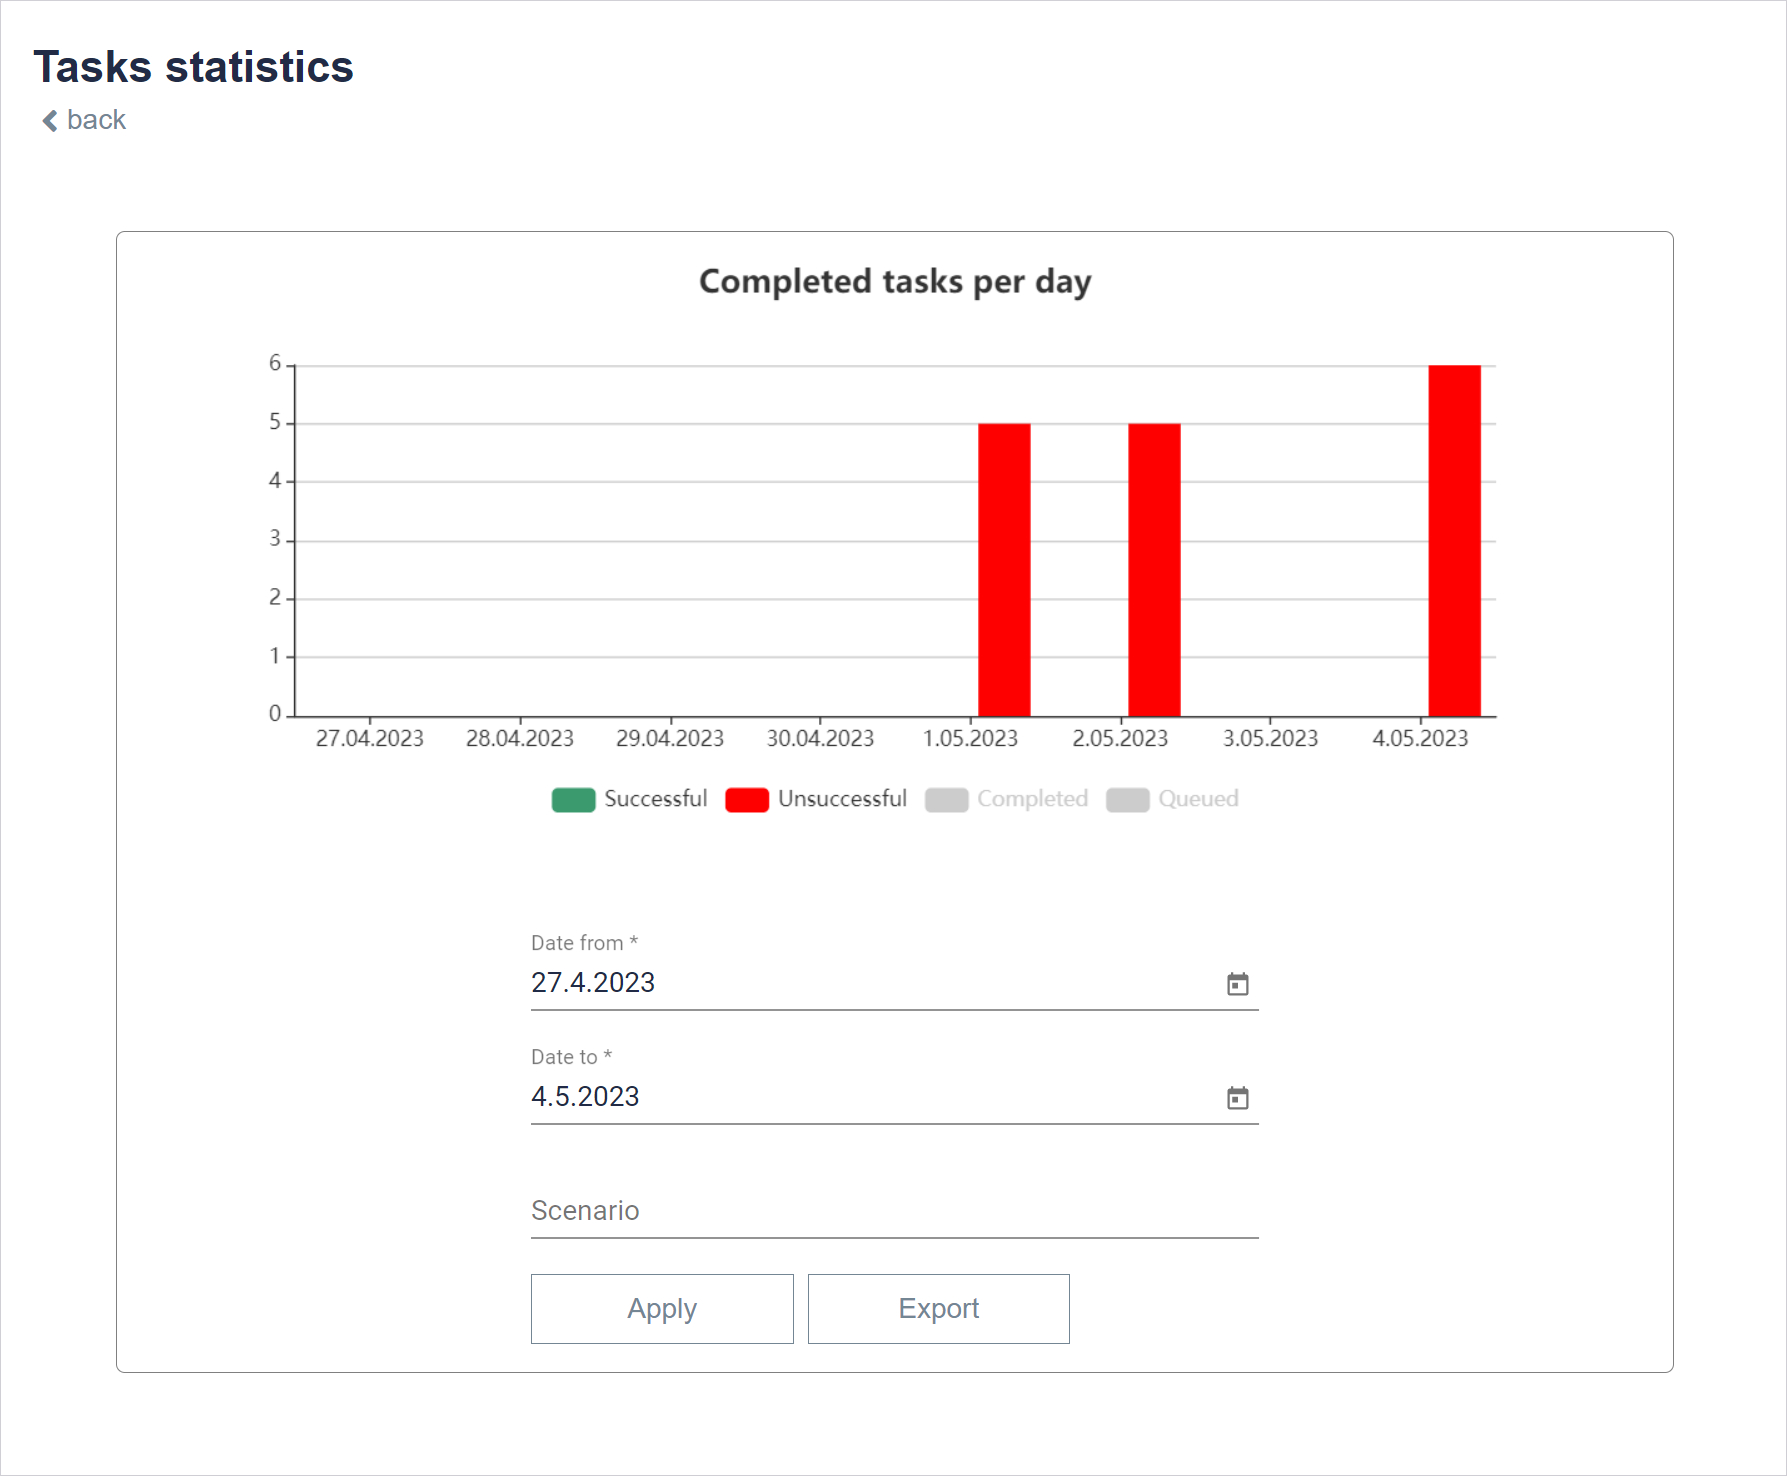
Here you can select or enter the time range from which you want to display statistics. In the Scenario field, you can enter or select from the drop-down list if you want to display statistics for one scenario in the selected period. Clicking Apply will be displayed on the screen. By clicking Export, an .xlsx file containing a table with data from the chart will be downloaded to the disk.
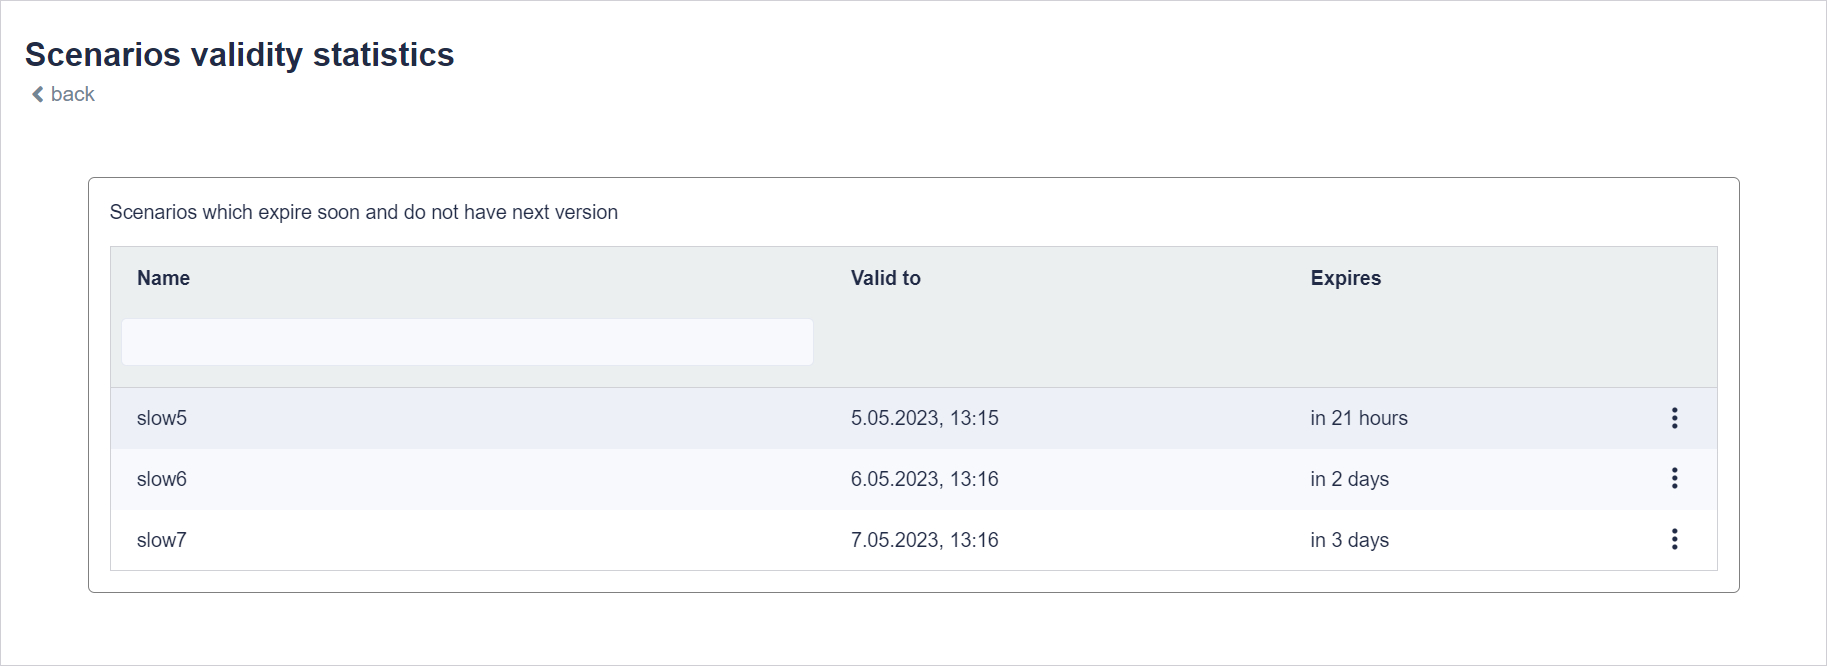
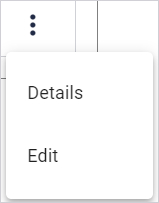
Here you can see which scenarios will expire soon. You can also see how much time is left. By clicking on the three dots to the right of each row you can view the details of a given scenario or edit it.
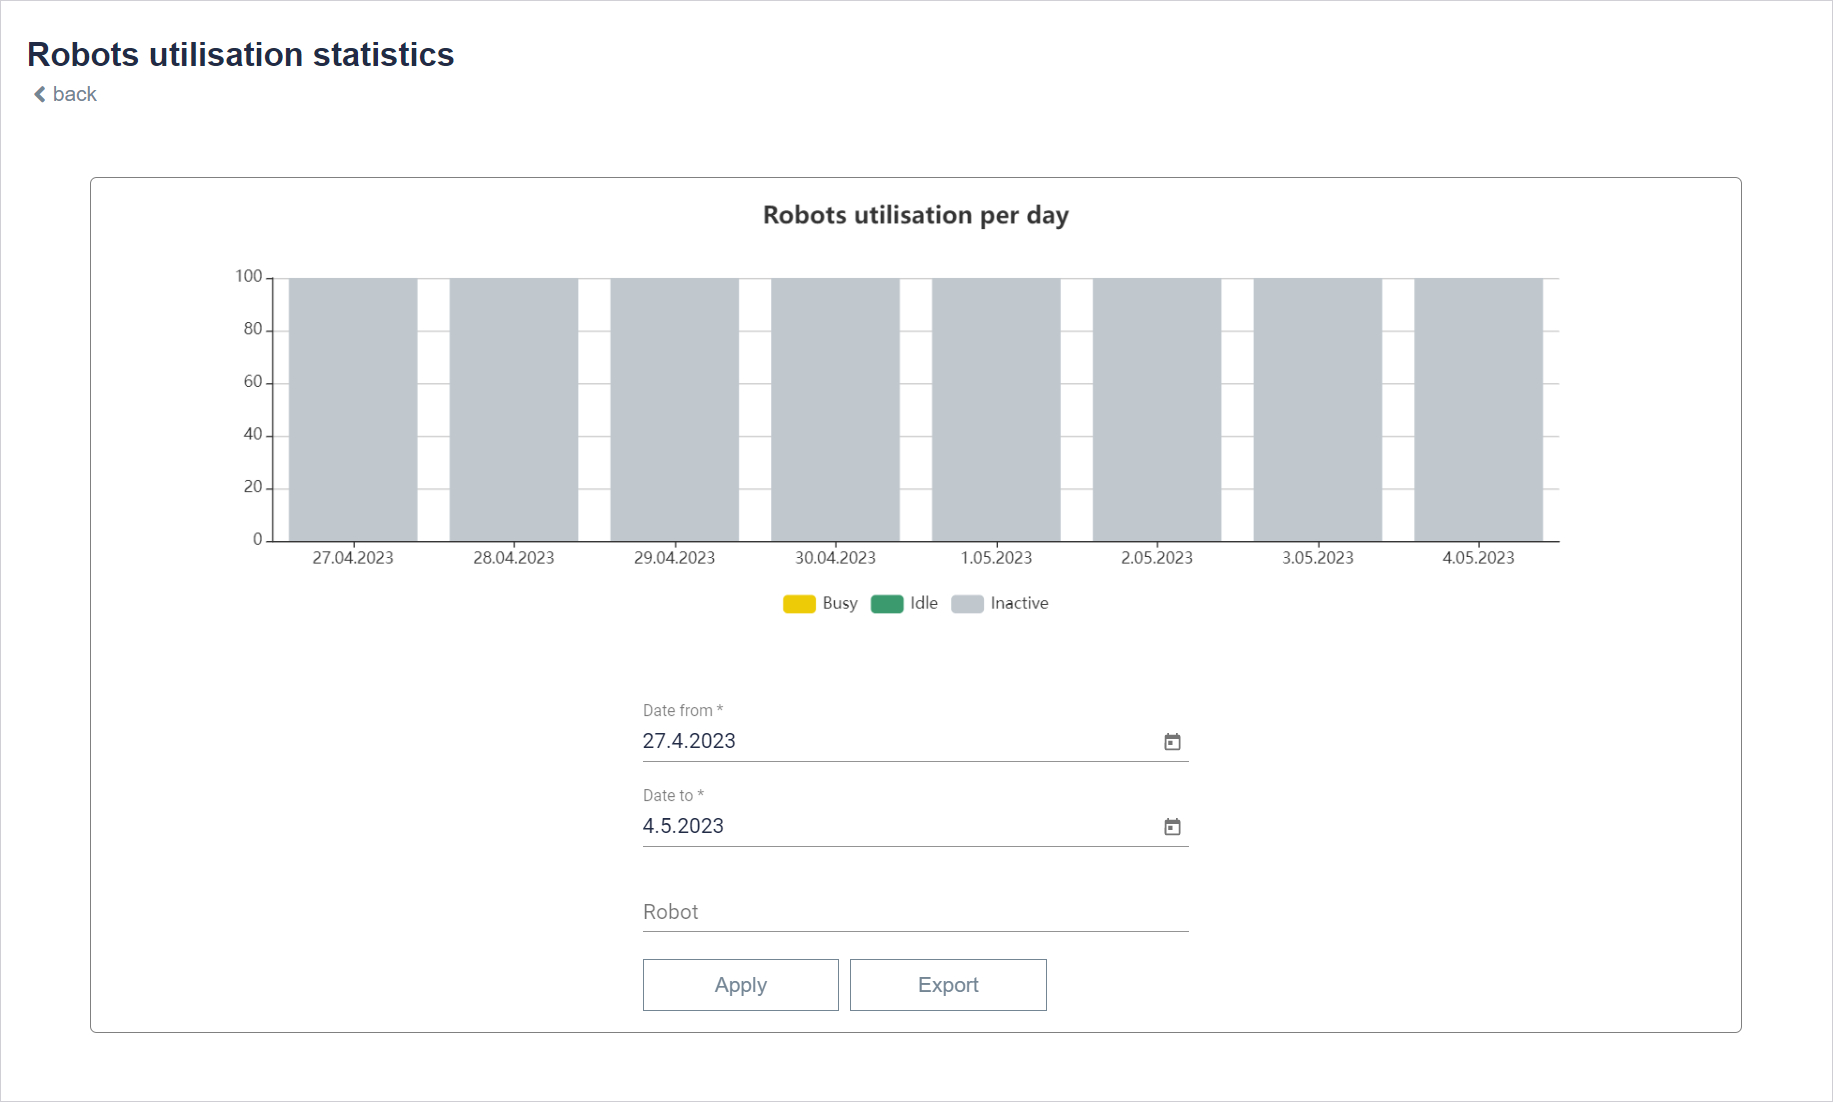
Here you can enter or select the time range from which you want to display statistics. In the Robot field, you can enter or select from the drop-down list if you want to display statistics for one robot in the selected period. Clicking Apply will be displayed on the screen. By clicking Export, an .xlsx file containing a table with data from the chart will be downloaded to the disk.
Last updated: April 26, 2023